AI MemoryA fifth of the wafers, a tenth of the bits.
AI Memory
A fifth of the wafers, a tenth of the bits.
High-bandwidth memory is the part every AI accelerator needs and almost nobody can make. In 2026 the world's three largest memory makers will spend about a fifth of their DRAM wafer starts on it and get back under a tenth of the world's DRAM bits — a product that destroys capacity in order to exist. That ratio, rather than demand, is what governs this market: it puts the allocation decision back on the table every quarter, and it makes 2027 a supply question before it is a demand one. This is a study of that market, read through the companies that hold its seven layers. No valuation and no price target.
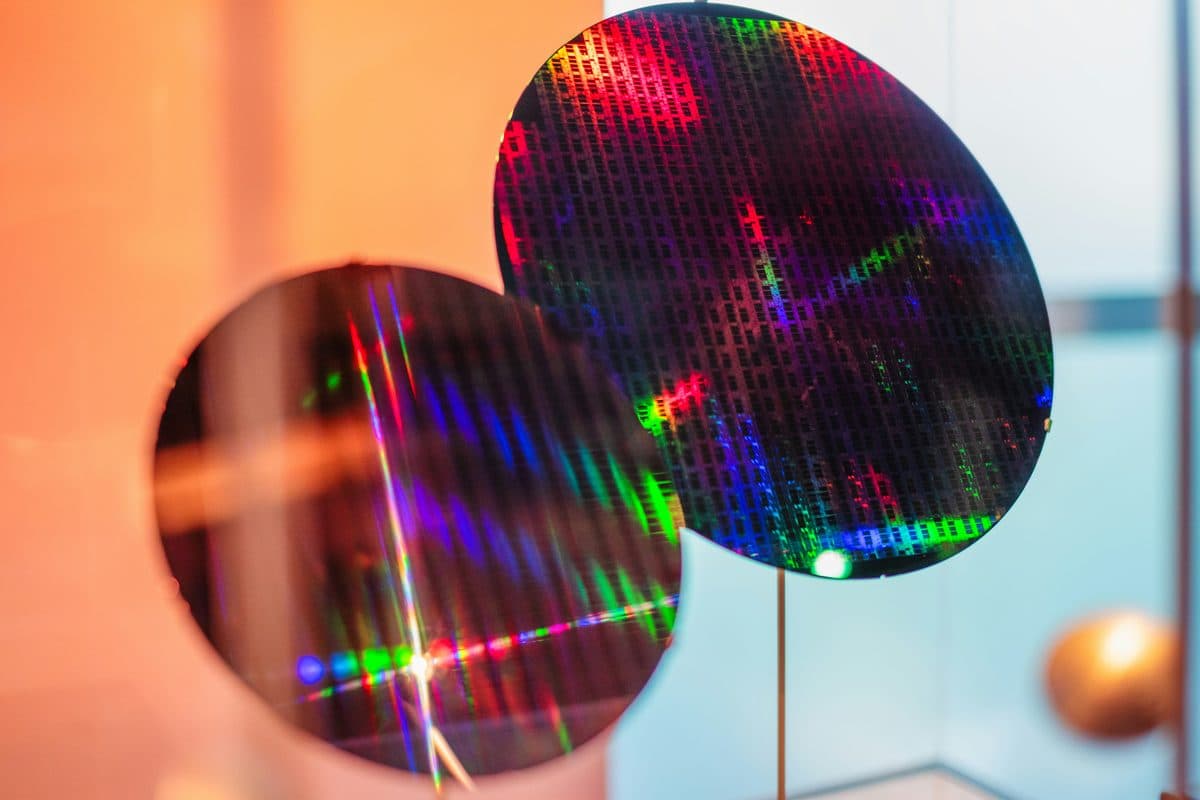
Patterned silicon, before any of it becomes a stack. What high-bandwidth memory does to a fab is unusual in one further way: the product sells before it is built. Micron had booked its entire calendar-2026 supply, HBM4 included, by December 2025 — so the constraint that decides a year is largely set before the year begins.
本研究简报以英文发布。
Every model that answers a question is held back by the same thing: how fast memory can feed the arithmetic. Between NVIDIA's P100 in 2016 and its B200 in 2024, dense FP16 throughput grew roughly 106 times while the memory bandwidth feeding it grew about 11 times. High-bandwidth memory is the industry's answer to that gap — DRAM dies thinned, drilled with vertical vias and bonded into a tower that stands beside the accelerator on a silicon interposer. The stack, not the die, is the unit of trade.
What makes the market unusual is what a stack costs to make. Wafer cost per gigabyte runs roughly three times DDR5, on an approximate three-to-one wafer ratio at Micron, so every unit of high-bandwidth memory removes something close to three units of alternative output. In 2026 that arithmetic will take about 22% of the DRAM wafer starts of Samsung Electronics, SK hynix and Micron and return about 9% of the world's DRAM bits. A fifth of the capacity of the three largest memory makers on earth, producing under a tenth of the memory. That ratio is the market, and it decides which numbers carry information: wafer allocation, qualification dates and stack height say more here than any revenue forecast.
Top-three DRAM wafer starts going to HBM, 2026
~22%
Returning about 9% of the world's DRAM bits, and projected to reach roughly 30% of wafer input by 2027. TrendForce, 2026-06-02.
Seven layers, and the two Korea does not hold
Seven layers separate a DRAM wafer from a finished rack. Korean suppliers hold the majority position in four of them — the die, the vias, the stack, and the machines that do the bonding. The two they do not hold sit in the middle. From HBM4 the base die beneath the stack stopped being a passive interface and became a logic part on a foundry node, and the interposer that seats the stack beside the accelerator has always been a foundry product; one foundry now supplies the base die for two of the three memory makers. A market that is more than four-fifths Korean by output is therefore Korean where the product is made and foreign where it is finished. Compilations of the Korean share run from 78% to 92% depending on who is counting, and none puts it below three-quarters.
NVIDIA, Broadcom-designed ASICs, four hyperscalers
~US$620bn guided 2026 capex
Three of the seven layers turn commodity DRAM into high-bandwidth memory. A different three ration what can be supplied — wafer capacity, advanced packaging and qualification — and only advanced packaging sits in both sets.
There is no agreed size for this market
Ask six research houses how large HBM was in 2026 and two answers come back an order of magnitude apart. The semiconductor specialists — Gartner, Goldman Sachs, Bank of America, Yole Group — put the year between US$45bn and US$60bn, measuring stacked-DRAM revenue at the maker. The generalist publishers cluster near US$3.7–4.0bn on narrower definitions. The two families are counting different things, so the midpoint between them describes nothing and averaging them produces a figure no house holds.
The forward axis has a harder edge than the backward one. Gartner's US$86bn for 2027 is the last specialist point on the record; past it the published figures thin to a supplier's own outlook and a superseded vintage. The widely circulated US$170bn-by-2031 number is not an HBM figure at all — it is Yole's 2024 total memory market, DRAM plus NAND together, transposed onto HBM by an aggregator. Which is why the chart below plots capacity rather than revenue. Wafer share is measured, published by one house on one basis, and it is the quantity the market actually turns on.
What HBM takes, and what it returnsTrendForce, 2026-06-02; 2026 and 2027 are projections. The wafer-input series covers Samsung Electronics, SK hynix and Micron; the bit-supply series covers the whole DRAM industry. The denominators differ; both series are drawn on one percentage scale.
Demand here is a ratio, not a unit count
Accelerator unit forecasts are close to useless at this resolution: estimates for a single 2026 part span 200,000 to 5.7 million units on inconsistent definitions. Content per accelerator is the variable that holds instead, because each generation has to carry enough bandwidth to keep its own arithmetic busy — 192GB on the Blackwell B200, 288GB on Rubin, 384GB targeted for Rubin Ultra. A flat unit count still produces heavy bit growth while content per unit climbs, which is how demand growth above 70% could be projected for 2026 in the same season unit forecasts were being cut. The lever runs downward too. The largest buyer has been evaluating shorter stacks than the ones it originally specified.
The tightest hold sits outside the memory layer
Three companies hold more than 90% of DRAM revenue and are the only volume suppliers of high-bandwidth memory. Within that, SK hynix sits somewhere between 56% and 62% depending on which house is reading, with Samsung and Micron each in the high teens to low twenties and the order between them disputed. It is a concentrated market on any reading. It is also the concentration everybody already talks about.
The tighter hold is one layer down and easy to miss. Every HBM stack in the world is assembled on a thermocompression bonder, and roughly seven-tenths of those machines come from a single Korean supplier that makes no memory at all. Nothing contractual keeps a fourth memory supplier out of this market; the barrier is complexity across design, fabrication and packaging, and the capital to carry all three at once. Putting the question to each layer — how many credible suppliers exist here — locates the fragility somewhere other than where the headlines keep pointing.
Thermocompression bonders supplied by one company
~70%
The tightest single-company hold anywhere in this chain belongs to a firm that makes no memory. Asia Business Daily, 2025-12-22.
“A capacity market with a price attached, gated by qualification, concentrated at the layers nobody names, and honestly forecastable only as far as 2027.”
— Nathan Research Group, Korea Market Series N° 01
Which variable governs 2027
Bit shipments are projected to grow 50–60% next year and still fall short of demand growth. That shortfall usually gets read as a demand story, but the capacity funded to relieve it lands in 2027 and 2028 — after the year it was meant to fix. The useful question is not how large demand becomes. It is which variable sets the clearing quantity, and there are three candidates.
Path
Governing variable
Where wafer share lands
A · Supply-governed
Whatever the fabs deliver
~30% of top-three wafer input
B · Allocation-governed
Whether HBM is the best use of a wafer
A 22–25% plateau
C · Architecture-governed
The memory hierarchy widens (High Bandwidth Flash, 3D DRAM)
A ceiling, from around 2030
Three market environments, and the variable that governs each. Anchored to published figures; none is a base case. Sources: TrendForce, 2026-06-02 and 2026-08-04; Open Compute Project High Bandwidth Flash specification, 2026-08.
Path B leaves the least evidence in the forecasts and the most in the quarterly numbers, because the supplier settles it internally and never announces it.
The second path is the one this market keeps demonstrating and forecasters keep leaving out. In the first quarter of 2026, HBM wafer revenue fell below the price of a 64GB DDR5 RDIMM, and suppliers began setting the split by how HBM pricing resolved — a premium product losing a quarterly allocation contest to the commodity it had displaced. A forecast that models demand without modelling that choice has modelled half the problem.
One more thing is worth carrying away, and it concerns timing more than size. Every position in this chain was fixed years before the market that rewarded it existed. The leader's advantage dates from a packaging decision taken when HBM was a graphics part; the tool maker's share from having already built the right machine; one Korean packager's growth from a long-term contract signed in November 2021, before the demand arrived. Nobody in this chain moved into position after the demand showed up, because qualification cycles run longer than demand cycles. In a market gated that way, the qualification calendar leads the order book.
与 NRG 合作的方式
与 Nathan Research Group 合作。
Research houses establish the shape of this market. They do not settle the questions that decide a diligence outcome — how HBM4 allocation is really split between the three qualified suppliers, what stacking yields actually are, whether hybrid bonding resets the tool layer or merely postpones the contest, and which Korean packagers sit behind HBM demand when no filing names the product. Every figure in circulation on those four is a third-party estimate. That detail sits with the people who design, qualify, build, tool and package these products, and reaching them compliantly is what we do.
韩国首家专家网络 — 首尔,2013年至今
我们会请谁到场
Former memory executives
DRAM and HBM product, process and planning leadership from the Korean suppliers and their US peer — on wafer allocation practice, qualification timetables and how a generation actually gets committed.
Packaging & stacking engineers
Through-silicon via, molded underfill and non-conductive film process owners, and the hybrid-bonding teams behind the transition expected no earlier than 16-high HBM4E.
Back-end equipment specialists
Thermocompression bonder qualification, tool economics and the roadmap contest in the layer where one supplier holds roughly seven-tenths of the market.
The HBM value chain in seven layers, and how tightly each is held. Sources: IDC Q1 2026 via SK hynix's SEC Form 424B4; TrendForce, 2026-01-21, 2026-03-20 and 2026-06-15; Asia Business Daily, 2025-12-22. Row 7 sums the four hyperscalers' own 2026 capital-expenditure guidance at range midpoints; compilations of the same four circulate higher, in a US$700–760bn band.
The layer HBM4 pulled into a memory market: logic base dies on foundry nodes, interposer allocation, and how much of this market's value migrates toward foundry from here.
Outsourced assembly & test operators
Where packaging demand actually lands in Korea and Southeast Asia — the bumping, test and back-end lines whose audited segment revenue moves before any estimate does.
Accelerator & hyperscaler procurement
The buyer side: qualification practice, allocation behavior under shortage, and the stack-height decisions that reset content per accelerator.
项目怎么推进
1范围界定
把您的投资逻辑,转成具体的专家画像和问题清单,对准您需要落定的那几个决定。
2寻访与核实
每一位专家在访谈前都要过一遍:课题相关性、经验的时效性,以及有没有利益冲突。
3组织与归纳
按您的时间安排访谈;需要的话,另附一份按问题逐条对应的书面归纳。
如果您的团队正在评估 the HBM supply chain、the Korean memory and back-end complex,乃至范围更大的 Asian semiconductor value chain,请告诉我们您眼下要做的是什么决定。